
Mapping Toledo’s Changing Neighborhoods
Posted on April 7, 2025
by Elisha W
In the 1930s, the jobless rate in Toledo was nearly 80% and citizens across the city were feeling the effects of the Great Depression. Social surveys and maps tell the tale. Social Condition maps from 1933, like this one, are visual representations of social and economic survey data, broken down by ward and census district. Track the data on the maps and you can follow the story of the pressures and hardships exerted on Toledo families by the circumstances of the times, and the resourcefulness and resilience with which they responded to those pressures.
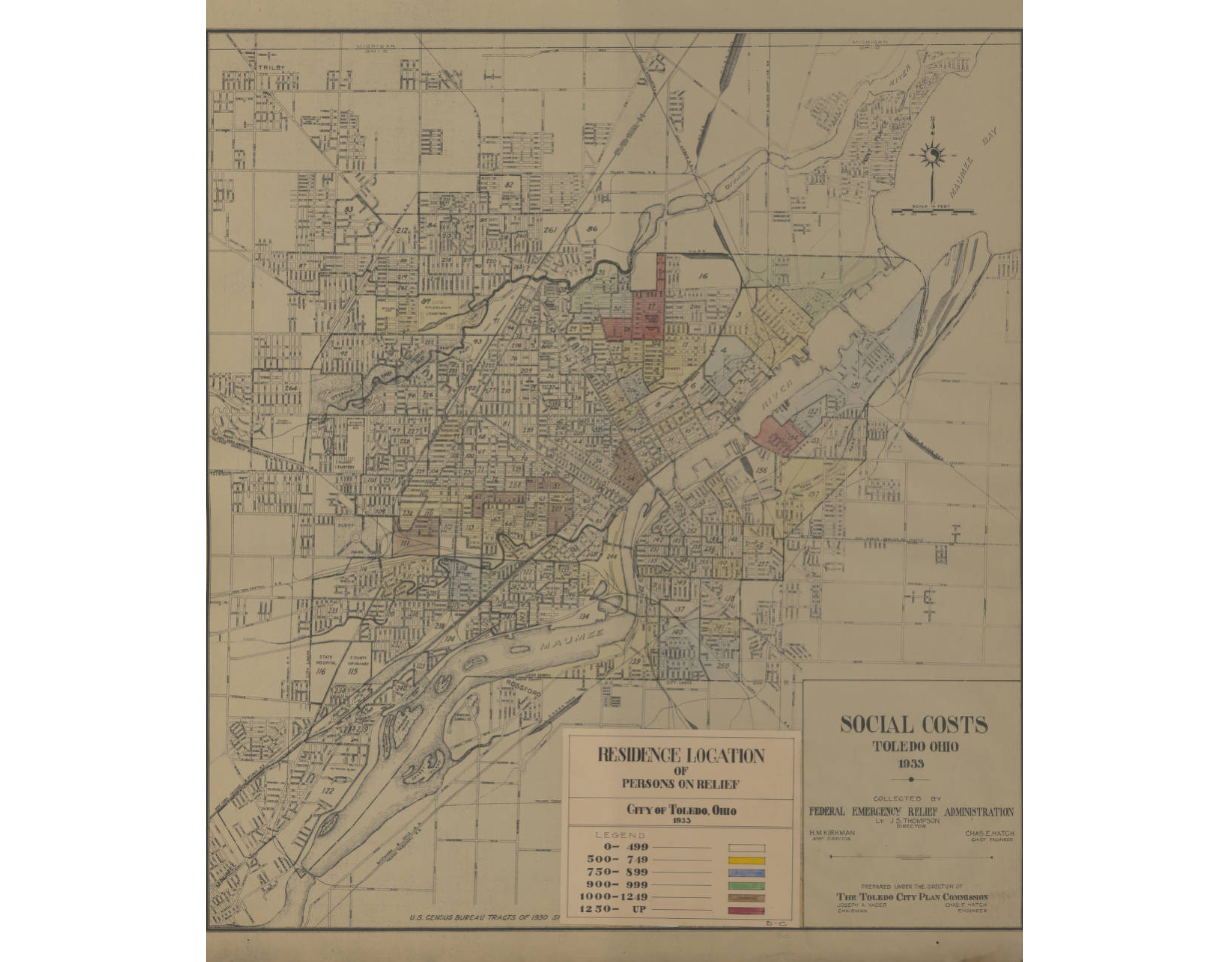
Toledo’s population was 258,447 as of Jan. 1, 1934. Citizens across the city, as well as the state and nation, were feeling the effects of the Great Depression. Federal relief provided food aid, employment opportunities, and housing. This map reflects the residence locations of Toledo residents receiving federal relief aid at that time. The map linked here uses colors to differentiate the per capita costs of the total relief load in different census districts.
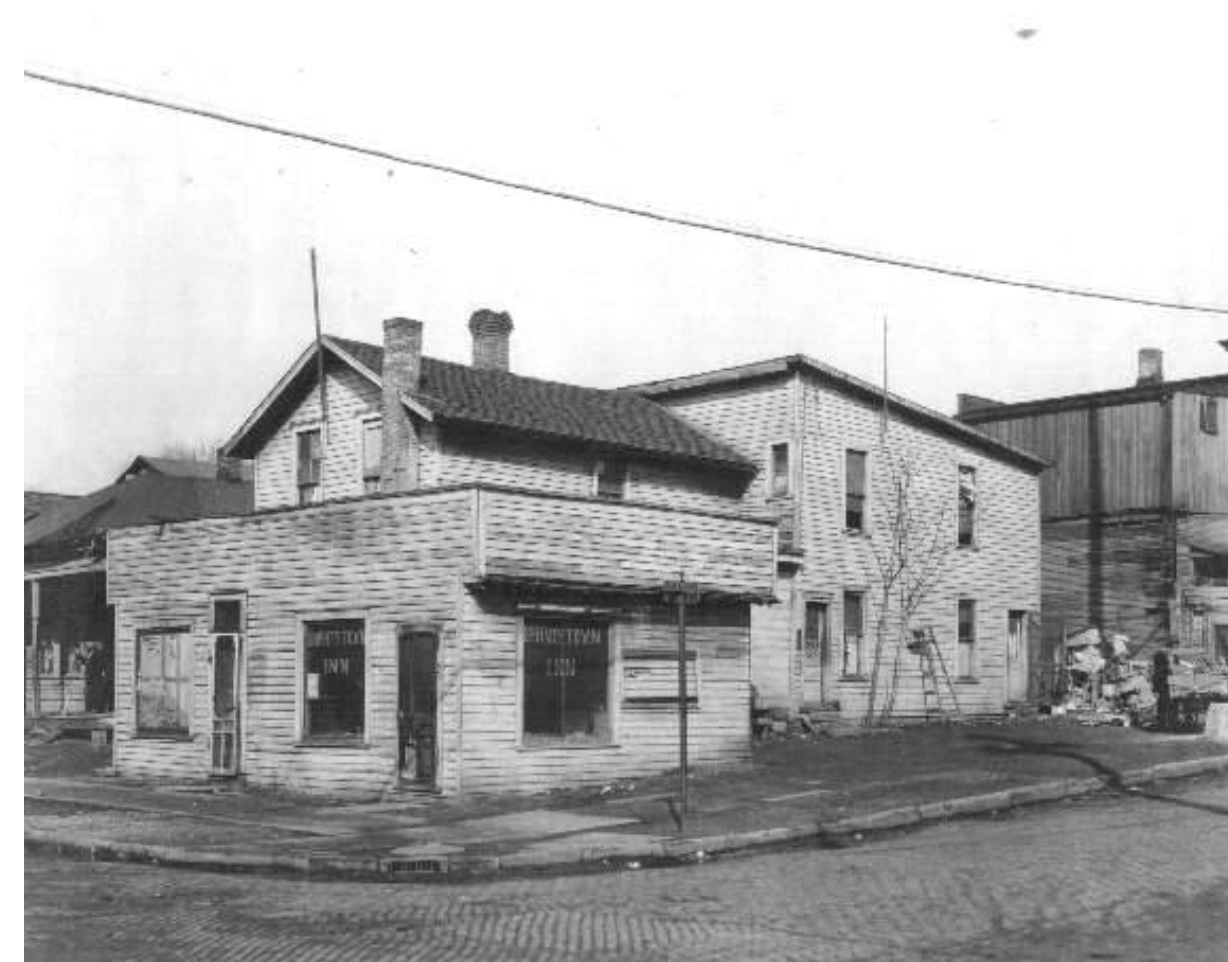
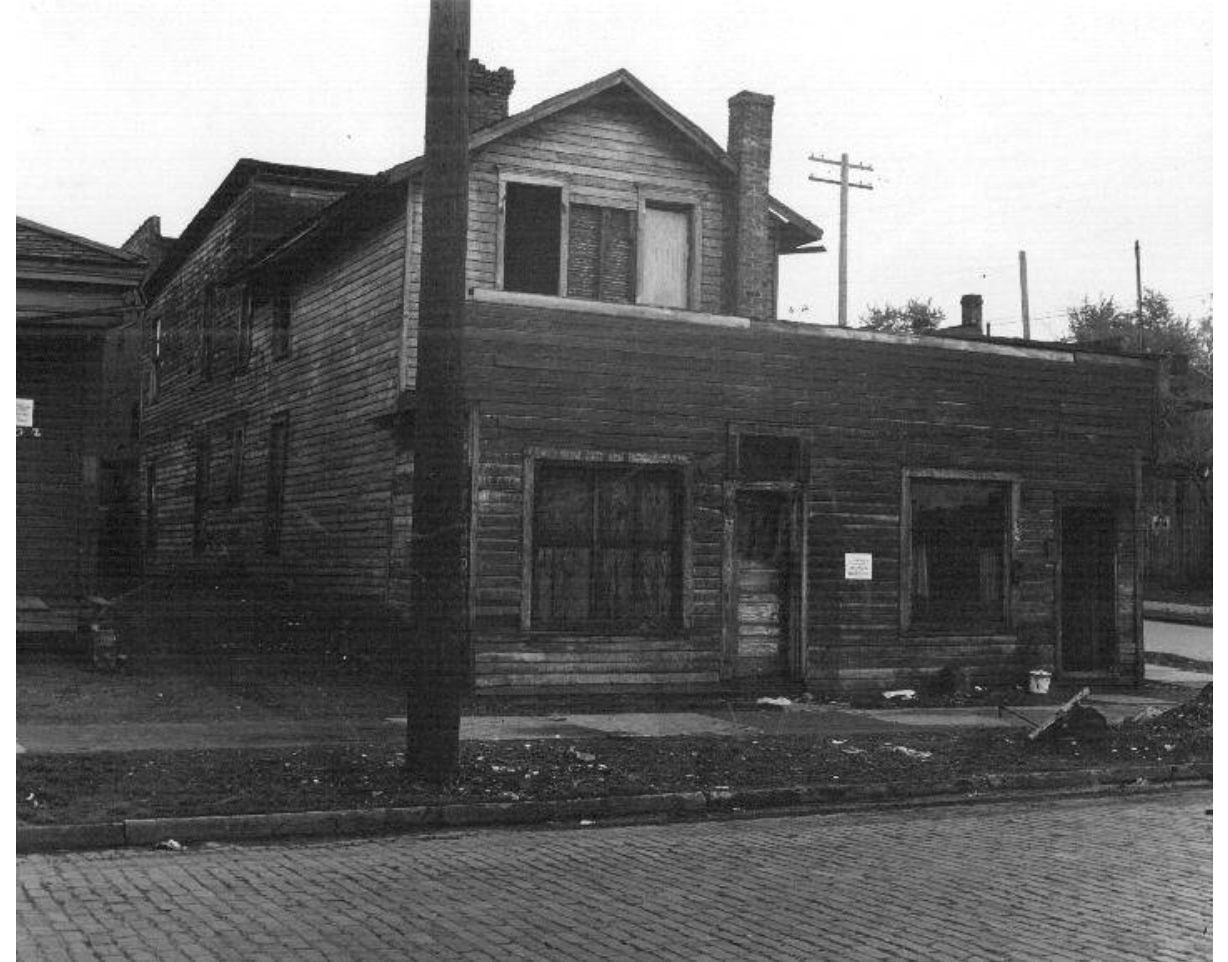
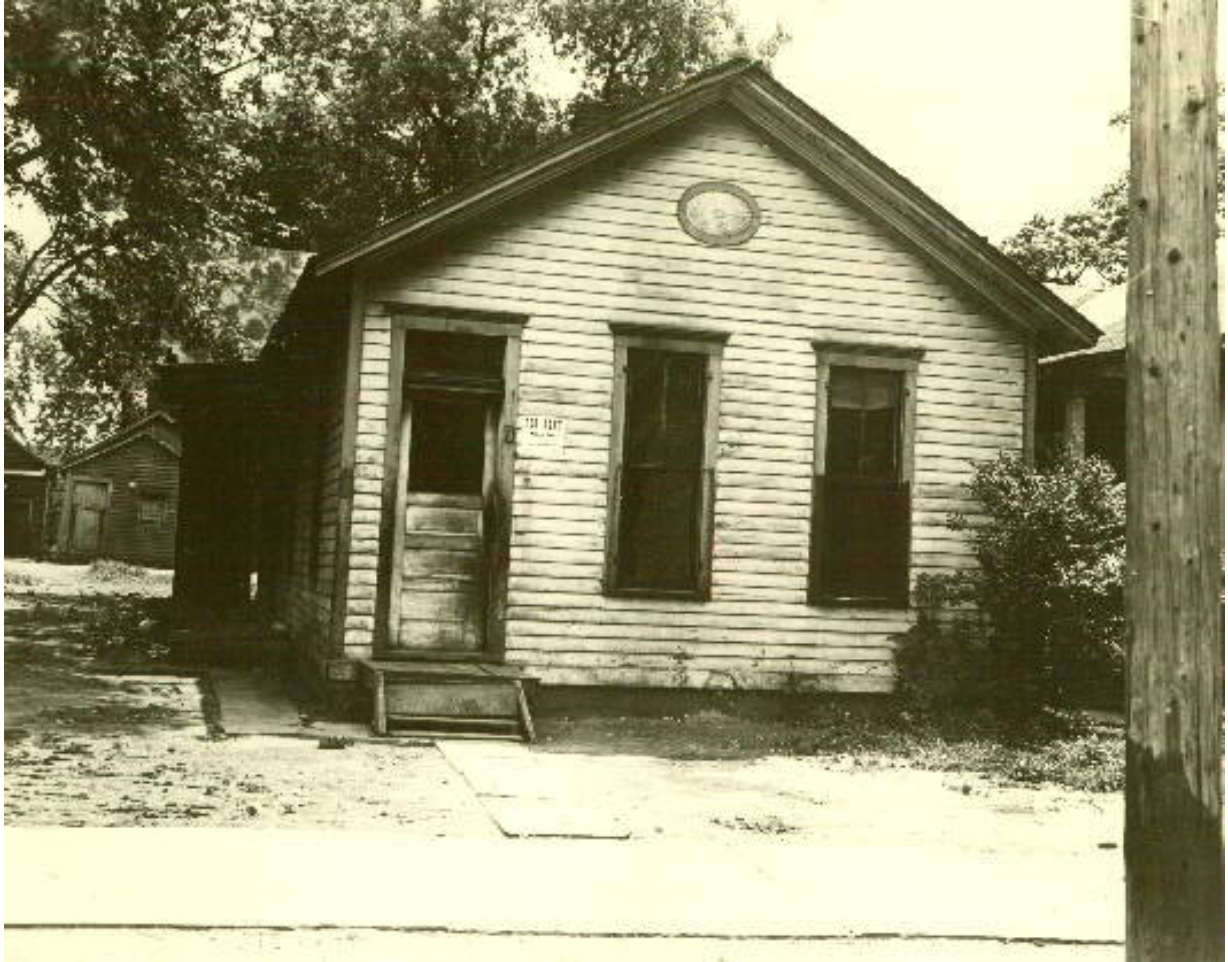
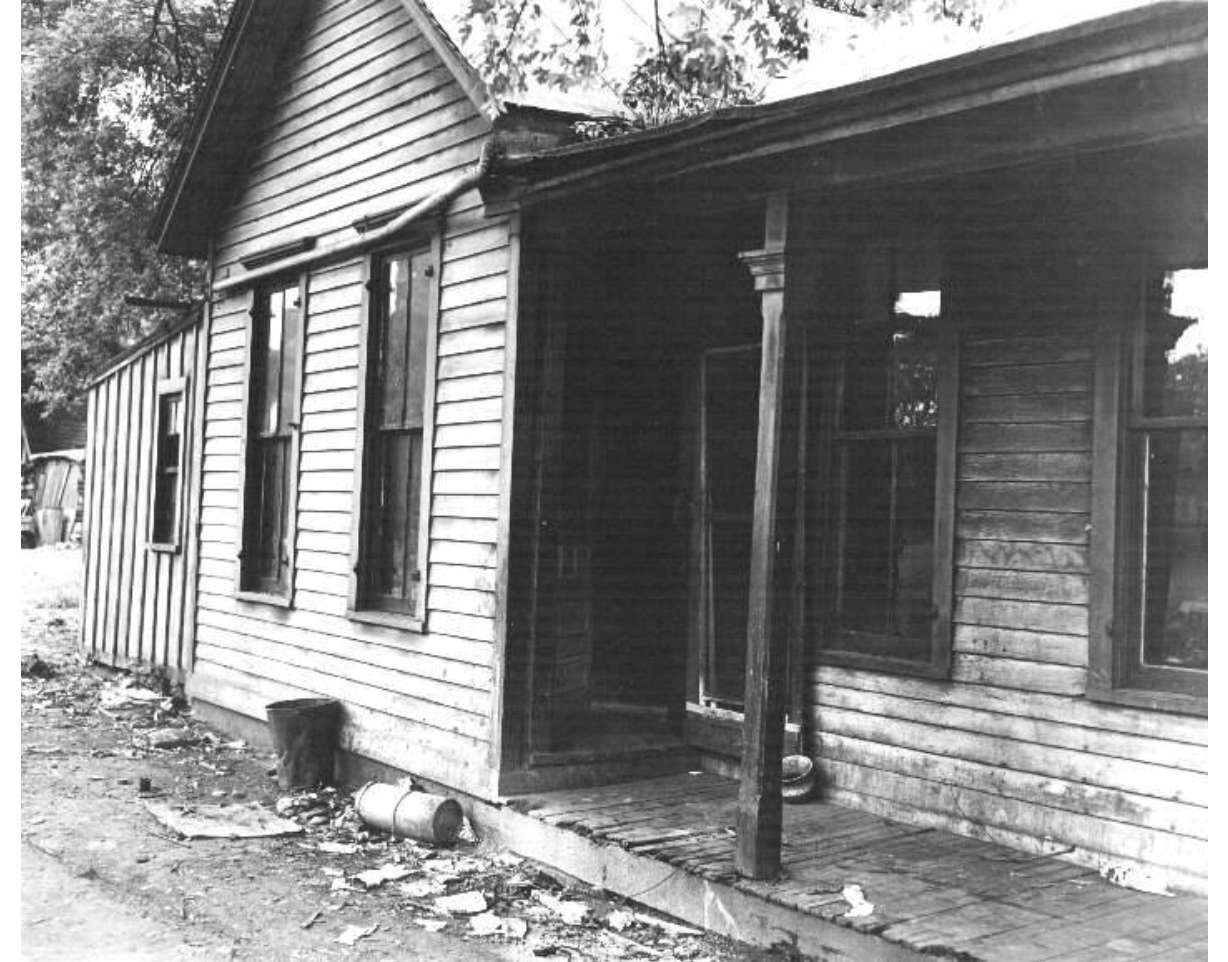
In Toledo, the Junction neighborhood— where many Black families had settled in the previous decade—was among the hardest hit by the economic downturn of the 1930s and 1940s. These images from OhioMemory offer a glimpse into the vibrant texture of that neighborhood’s daily life. It was in this struggling area, bounded by S. 15th St., Indiana Ave., Division St., and Hamilton St., that a site was chosen for the first Federal Housing Project in Toledo.
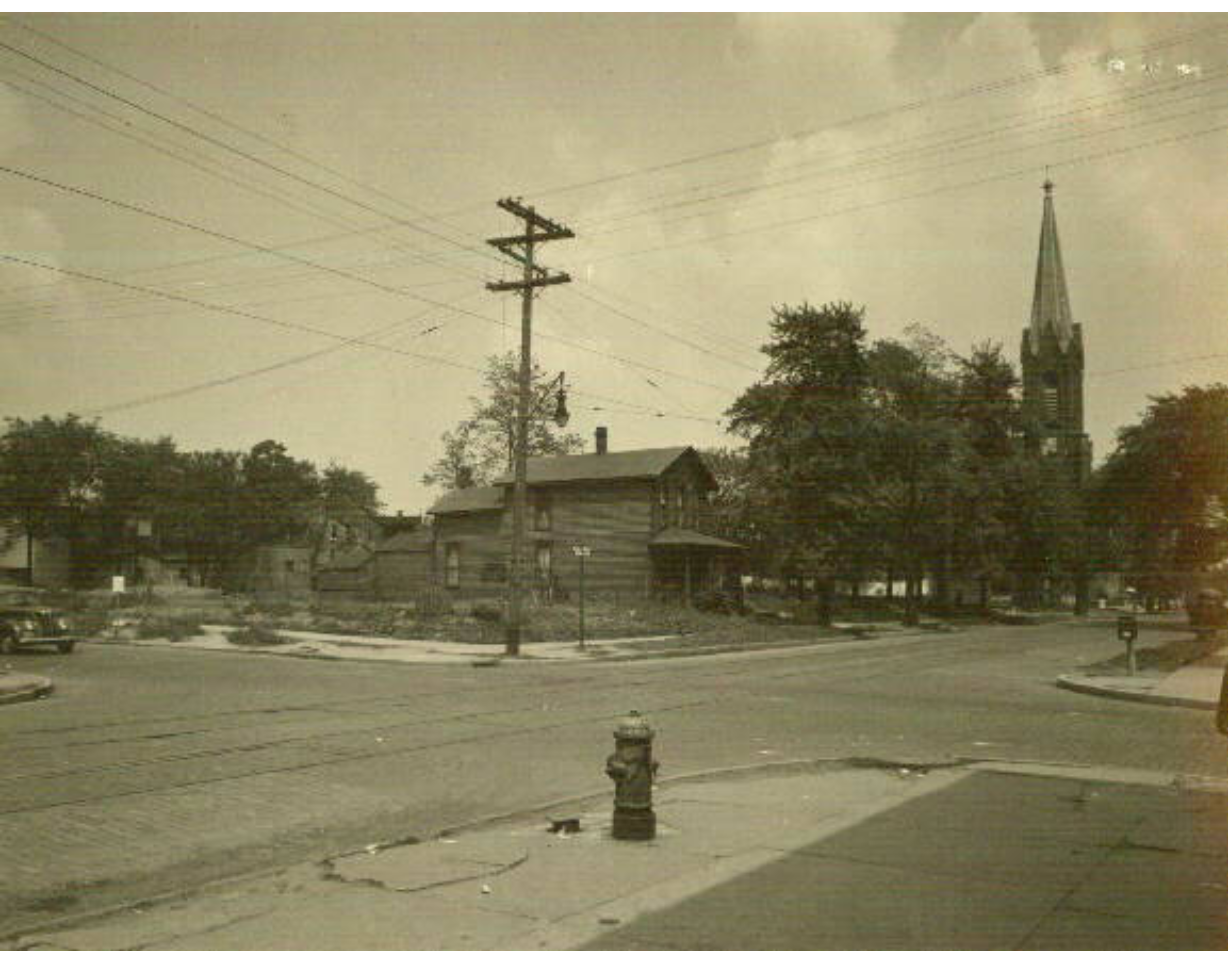
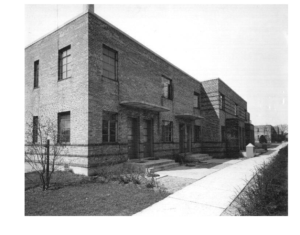
The Brand Whitlock Homes opened in the Belmont – Division neighborhood in 1938 as one of the first public housing complexes in the country. When they were demolished 74 years later, they were Toledo’s oldest public housing complex still standing.
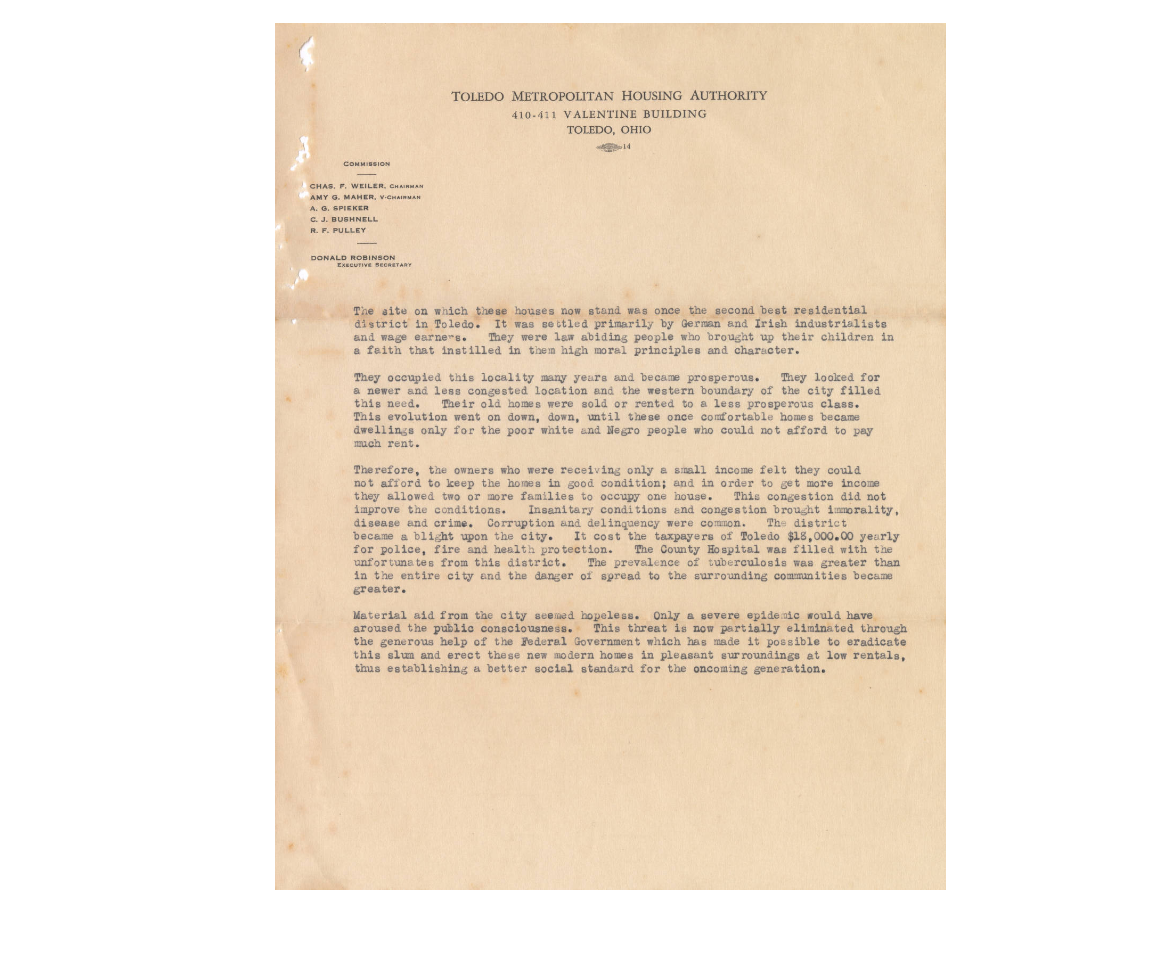
Demolition workers tearing down the Brand Whitlock structures in 2012 were surprised to unearth in a building cornerstone a copper box with documents shedding light on the establishment of the complex. The documents reveal why the neighborhood was chosen as the project site — some homes on that property had been condemned due to defective plumbing or a complete lack of running water or toilets, but most of the homes on the site were listed as reparable. Instead of allowing for the restoration of those structures, however, authorities chose to clear the landscape and turn it into public housing.
Throughout the 1930s and 1940s, eliminating neighborhoods for public housing projects like the Brand Whitlock Homes was a common occurrence, though different approaches were tested in other states. In Baltimore, the Waverly neighborhood was chosen as a conservation area due to its proximity to disadvantaged areas and the age of its residential structures. In the book “Waverly: A Study in Neighborhood Conservation,” the Home Owners’ Loan Corporation residential security maps (now called redlining maps) are mentioned as “of a confidential nature” that “cannot be made public… they clearly show the districts in which blight is destroying neighborhood values.” To see more Social Conditions Maps of Toledo, more photos of homes lost to neighborhood elimination, and additional items from the Brand Whitlock Cornerstone Collection, please visit the Toledo Lucas County Public Library’s Local History digital collections.
Did you like this blog post? Keep up to date with all of our posts by subscribing to the Library’s newsletters!
Keep your reading list updated with our book lists. Our staff love to read and they’ll give you the scoop on new tv-series inspired titles, hobbies, educational resources, pop culture, current events, and more!
Looking for more great titles? Get personalized recommendations from our librarians with this simple form.